LD TECHNOLOGY

OXI_W MODEL D009

OXI_W is intended for use:

  • To spot check or monitor Oxygen saturation of arterial hemoglobin (SpO2%) and pulse rate.
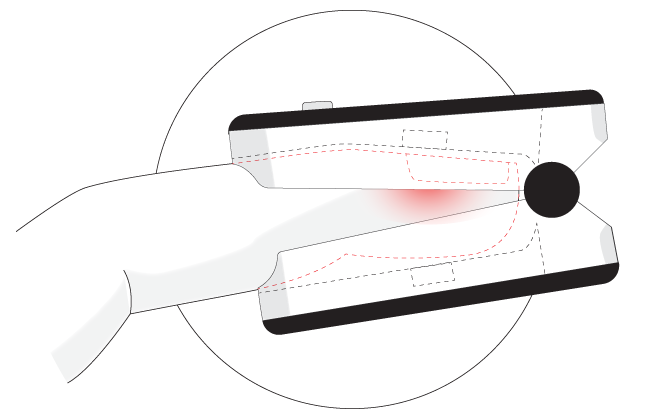
  • To analyze the pulse waveform (Photoplethysmography or PTG) provided by the oximeter. It only provides mathematical analysis of the input of the PTG using the first and second derivatives of the PTG values related to the microvascular condition.
  • To analyze the basic rhythms of the NN or RR intervals in heart rate from the PTG, both in the time domain and in the frequency domain (short time 5 minutes). It only provides mathematical analysis of the heart rate variability values related to the autonomic nervous system function.

FEATURES:

  • Photoplethysmography (PTG) analysis to assess the peripheral circulation.
  • HRV (Heart Rate Variability) analysis both in the time domain and frequency domain to assess early ANS dysfunction
  • Ewing Tests analysis (Valsalva maneuver, deep breathing and K30/15 tests) to assess cardiovagal failure.
PTG uses transmitted infrared and red light to measure oxygen saturation and relative blood volume in the fingertip. PTG waveform are reflective of blood movement in cutaneous vessels and can be used to identify synchronous depolarization of cardiovascular tissue.​

OXI_W

REVIEW

OXI_W PLACEMENT

CARDIAC AUTOMATIC REFLEX TESTS USING OXI_W

CODIV-19 AND MANOMETER USE

The tube connected to the patient mouth shall be exchanged after use . It is very easily to do it by pushing on the output attached to the manometer.
The used tube will be disinfected  with alcohol solution at 90% during 15 min. 
Please, contact LD Technology to order additional tubes with new outputs to exchange them after use.

ADVANTAGES OF THE OXI_W

Accuracy of the heart rate detection:
Comparing our algorithm using the first derivative of the photoplethysmography to EKG, the coefficient of correlation r=0.99.

Accuracy of the HRV analysis:
According to the standard ANSI/AAMI EC57, our results are in compliance with the Input MIT-BIH database.

Research and development i.e. clinical studies:
The PTG spectral analysis using OXI_W is patented. Results are Off label Use.

PTG mathematical analysis markers were compared to:

Gold standard of Insulin resistance assessment:
Hyperinsulinemic Euglycemic Clamp (HEC), PTG-TP marker returns a sensitivity = 95.7%, specificity = 84,4% and the area under the ROC curve (AUC) = 0.929 for identifying insulin resistance.

Oral Glucose Tolerance Test (OGTT):
The correlations between the OGTT and photoplethysmography index (PTGi) were: r = – 0.56 (p = 0.003) for glucose and r = – 0.41 (p = 0.04)for insulin

Coronary angiography:
PTGi returns a sensitivity of 86.1% and specificity of 87.1% and the area under the ROC curve ( AUC) = 0.926 for identifying endothelial function.

STAND UP TEST

DISCOVER OUR PRODUCTS CATALOG